As you may have noticed, the next release version will be 3.14 and therefore, we will call it ‘Pi’.
Usually our versions are named for community meeting locations and the splash screen shows a map related to this location.
For 3.14 we were looking for creative maps that capture the essence of Pi.
Submissions
The submission phase was open for two weeks and we received numerous inspiring submissions:
Public voting
From these submissions, a short list of top 3 candidates was compiled and put up for the public vote:
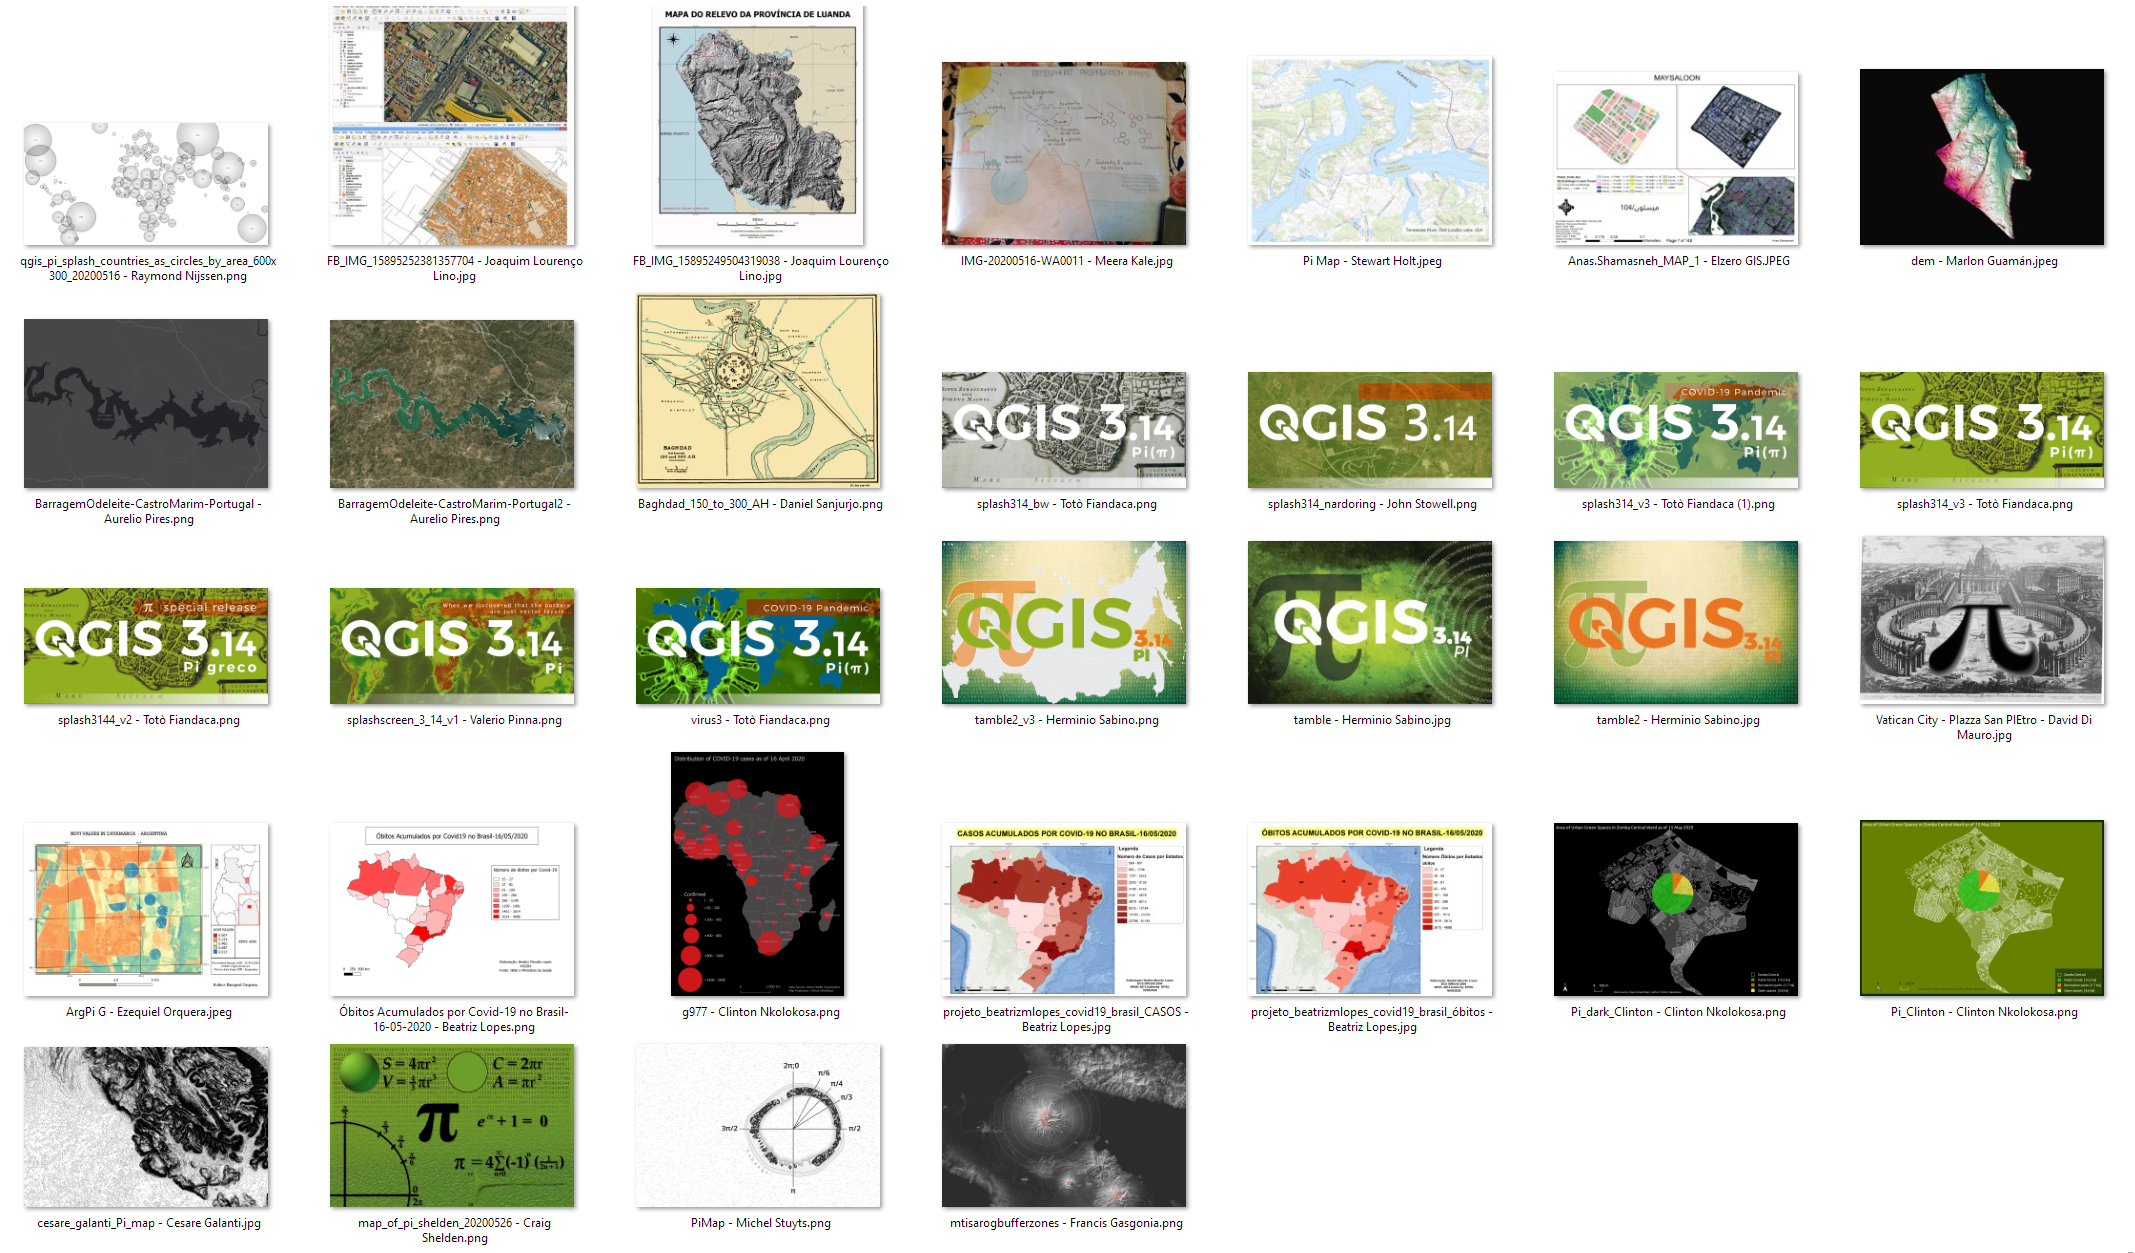
Candidate #1 Ezequiel Orquera writes about his submission: “As an agronomist, Pi is used every single time that you need to develop a pivot irrigation system (those nice circles we can see on sat. images), making most use of Pi number and the radius. In this image, we can see the circles in contrast with rectangles shapes. The interest thing is that on most of the circles you can see the irrigation system arm that is coming from the center of each circle, making it the radius. Furthermore we all know that Pi x r^2 = circle area. This is useful to estimate for example, crop yields.”
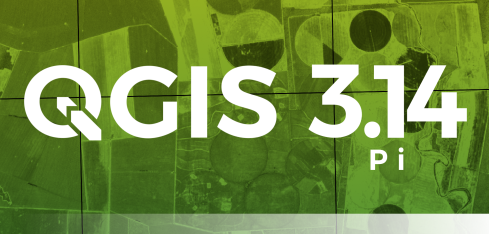
Candidate #2 Francis Josef Gasgonia writes about his submission: “This map would not be complete without the use of Pi. Multicentric ring buffers represent potential danger zones in this map of Mt. Isarog in the Philippines. The calculations necessary to develop the ring buffers depend on Pi. Mt. Isarog is classified as a potentially active stratovolcano. This map best represents the use of Pi in a map because these buffers are crucial in disaster planning, especially now in a Covid-19 pandemic world; wherein ring buffers, and other types of buffers are in use for humanitarian and logistics planning.”
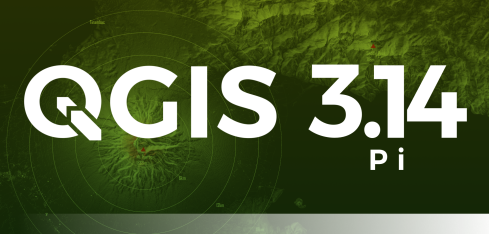
Candidate #3 Michel Stuyts writes about his submission: “Since Pi is very much linked to circles, I looked for the most circular place I could find. The place I made a map of is Vahanga, an atoll in the Pacific Ocean. I decorated the map with angles of a circle in radians as divisions of Pi. Because QGIS splash screens usually show a map of a location where a developer meeting was, the chance it would ever have a map of this part of the world is just as irrational as Pi, because the closest inhabited place is more than a 1000km away. My map is also linked to Corona (the reason there was no dev meeting in the first place), because the atoll is crown shaped and Corona means crown. Besides being linked to Pi and Corona, my map is also very much linked to QGIS, because it’s 100% made with QGIS. The angles in radians where made with “geometry generators” from the central point. The fills where made using “random marker fills” combined with an expression using “randf()” to set the size of the markers with a “Data defined override”. For the shallow water on the inside of the atoll I used a “Shapeburst fill”.“
And the winner is …
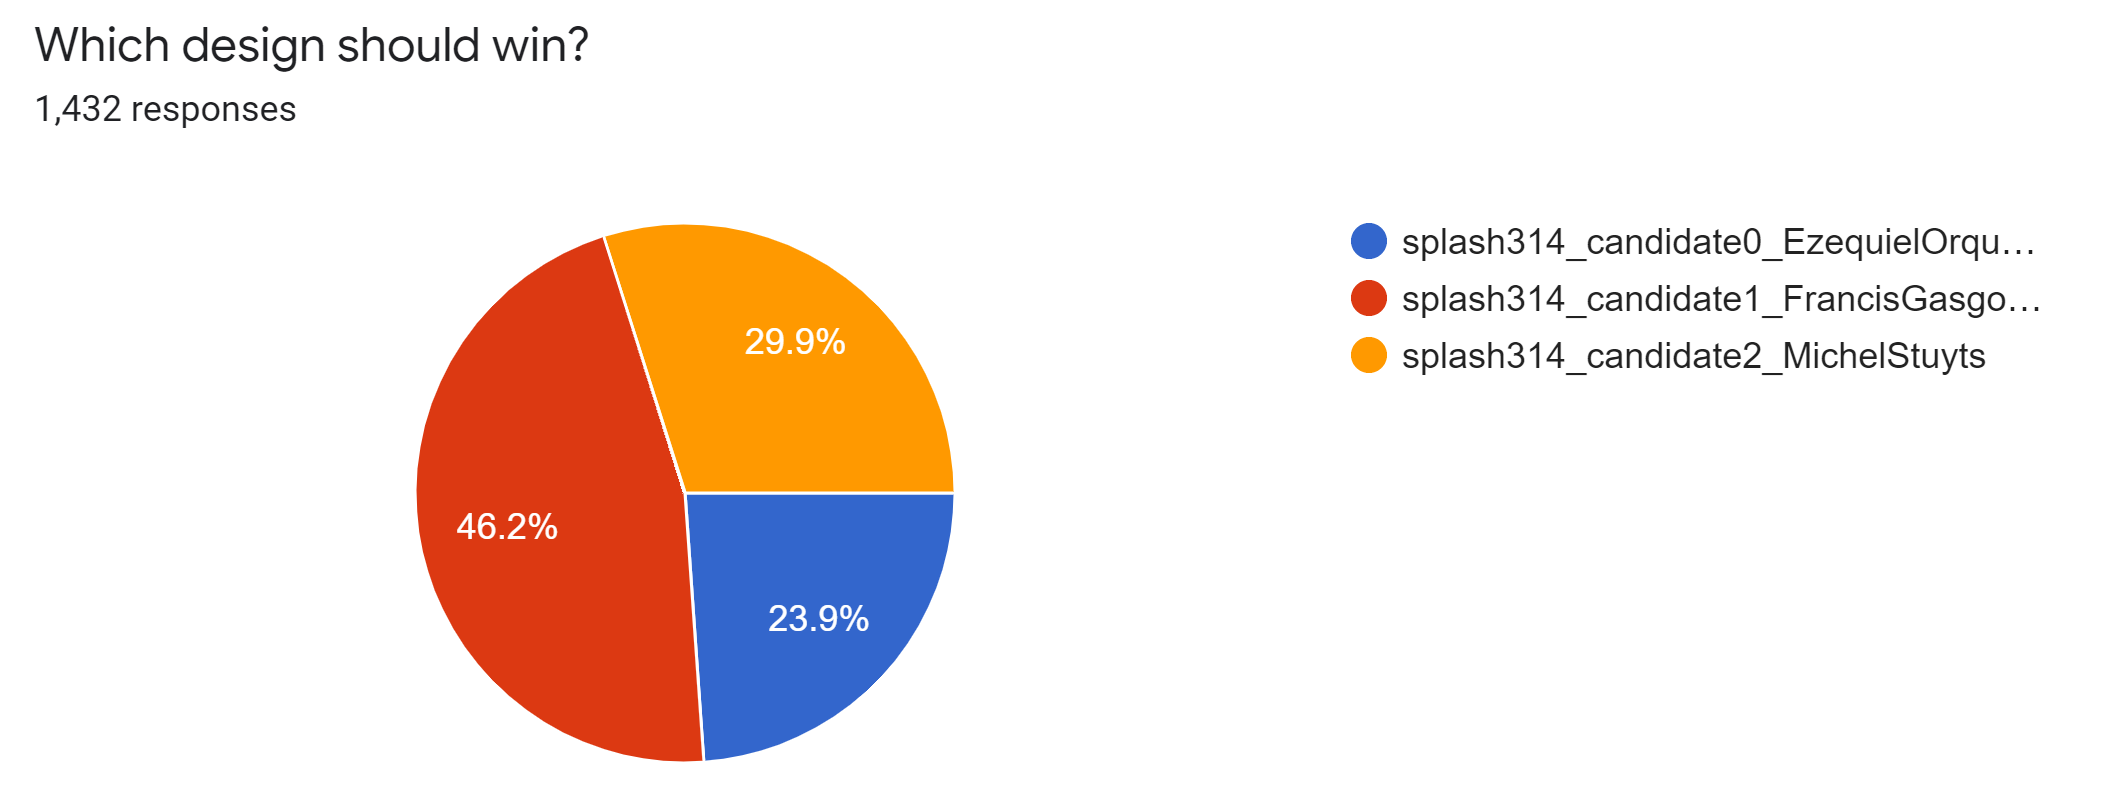
In the public vote, Francis Josef Gasgonia’s map received the most votes (46%):
Congratulations Francis and thank you again to everyone who participated in this fun contest to ensure that QGIS 3.14 Pi will have great visuals!
